
WaveML
Utilizing WaveML for Trend Tracking
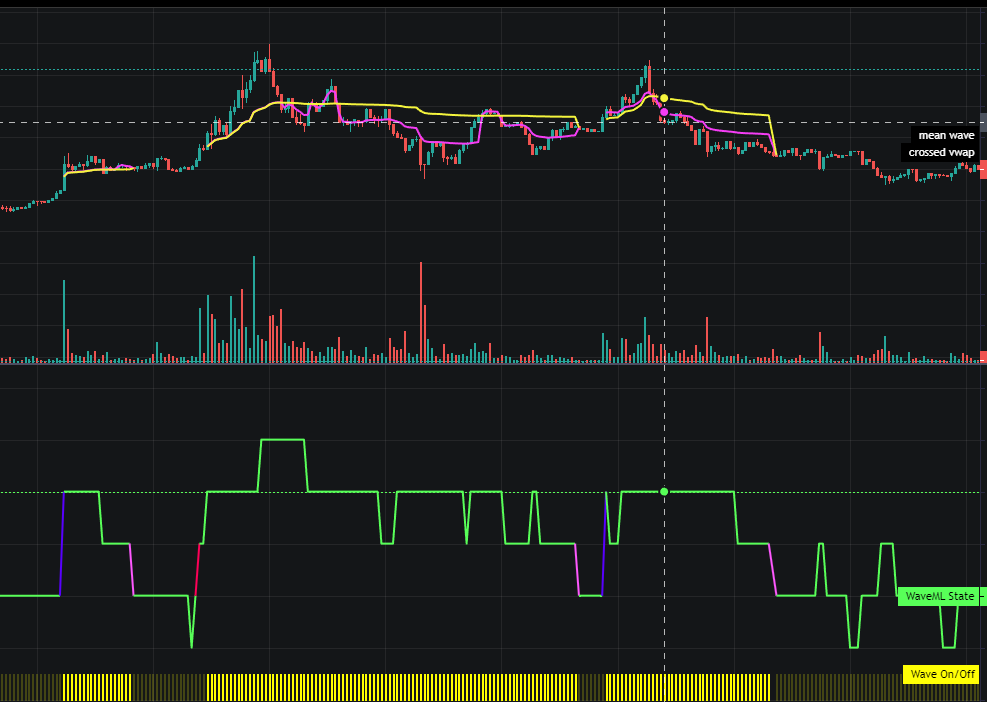
WaveML is composed of two key elements: the WaveML State (green) and the Wave On/Off Panel (panel). These elements play a crucial role in identifying short-term structural changes and trend continuations in the market, and will help identify trade opportunities arising from market inefficiency. Here's how to effectively utilize WaveML for directional moves:
Recognize Wave Phases: Pay close attention to three significant aspects of WaveML: 1.1 WaveML Inefficient Transition (Color: From Green to Red): This occurs when the WaveML State climbs like a ladder from one phase to another (e.g., 1=> 2 => 3). This transition pattern is a strong signal of a changing market state, but also exposing market inefficiency in the process, and typically makes for a good directional trade entry opportunity. 1.2 WaveML Efficient Transition (Color: From Green to Purple): These phases involve a more efficient jump directly from states [0,1,2] to [4,5]. When you observe this shift, it signals a more efficient directional move that may require caution in executing a trade after observing such a transition. Being more efficient of a move, there’s higher probability of a volatile burst or whiplash that may occur immediately in the other direction. 1.3 Once in a wave (bright yellow is on), note transitions from states 3 => 4 may signal trend continuation in the current direction. For confirmation of current direction, see below.
Confirm the Trend Direction: Once you've identified a state transition or continuation phase, the next step is to confirm the potential trend direction. To do this effectively, consider using technical indicators or other analytical tools like RSI and TTM. Alternatively, you can directly use WaveVWAP (see below). These tools can help you validate the direction in which the market is likely to move.
Watch for the End of the Trend Wave: Keep a close eye on WaveML as it may signal the end of a trend wave. When this happens, the WaveML State Transition color changes from green to pink, and the Wave On/Off bar switches back to a lighter mode. This shift indicates that the market is moving out of its recent trend range.
By following these steps and closely monitoring WaveML's visual cues, traders can make more informed decisions regarding trend-following trading strategies. WaveML provides valuable insights into market dynamics, helping traders capitalize on trend opportunities when they arise.
WaveVWAP (volume weighted price average)
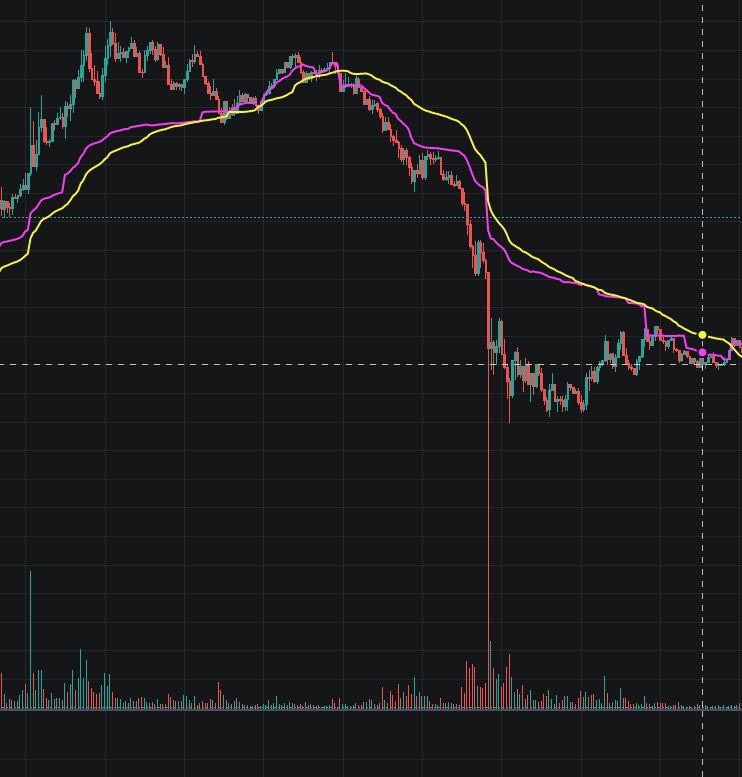
WaveVWAP is a powerful price and direction reference tool leveraging the WaveML model. The WaveVWAP, depicted in yellow, is a variation of the VWAP that initiates its calculation three minutes before the market enters the Wave phase (Wave On) and continues until the wave concludes. A noticeable event occurs when the WaveVWAP crosses the OHLC (the mean value of Open-High-Low-Close) - this marks the launch of the WaveVWAPCross, displayed in pink. The WaveVWAPCross refreshes calculation from the moment the WaveVWAP crosses the OHLC and persists until the wave's completion. These two indicators serve as valuable reference lines in tracking trend developments.
Here's how traders can effectively incorporate the WaveVWAP and WaveVWAPCross into their trading strategies:
Enhanced Smoothness: The WaveVWAP comprehensive calculation across the entire wave duration results in a smoother curve compared to the traditional VWAP. This smoothing effect aids traders in better recognizing the prevailing trend.
Dynamic Support and Resistance: Consider the WaveVWAP as a dynamic support or resistance level. It gains strength and reflects the trend's direction more accurately as time progresses within the wave. Traders can utilize it as a reference point for informed trading decisions.
Price Pattern Shifts: When an asset's price crosses the WaveVWAP, it can indicate a potential alteration in the price pattern. This crossing may signify a change in market sentiment or trend strength.
Early Position Exits: using WaveVWAP and WaveVWAP cross, traders can reference early position exit points or trade invalidation points for directional trades.
Last updated