# User Guide – An Example of Using 3 Insights
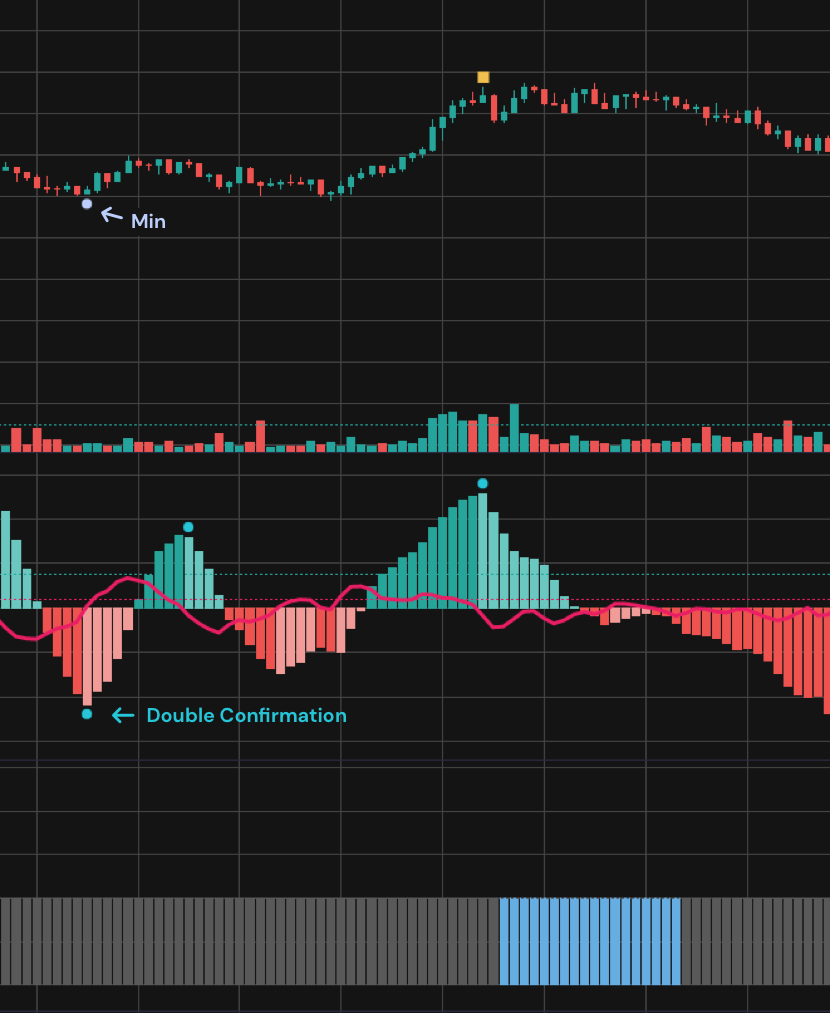
* When the VSM model is in State 1, representing a low volatility market, pay attention to the occurrence of "min" points on the candlestick chart. A "min" point indicates a short-term support level within a 40-minute time frame. If, at the same time, the AI Directional Strength Predictor histogram becomes lighter and a circular marker appears, it can act as a "double confirmation." This suggests that the price is unlikely to break through the support level identified by the "min" point. Similarly, if a "max" point appears on the candlestick chart, it signifies a potential phase of resistance within a price range.
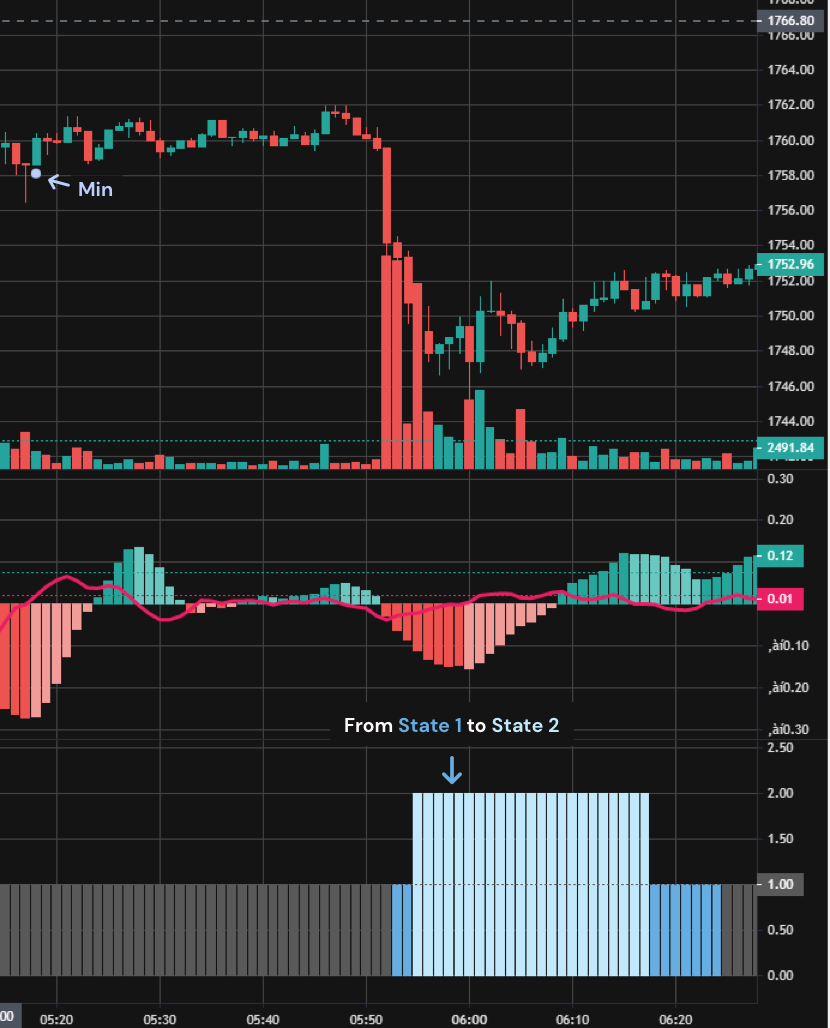
* When Transition from State 1 to State 2: If a "max" or "min" point occurs in State 1, and subsequent market developments transition into State 2, it indicates a change in market structure. In this scenario, the predictive logic associated with "max" and "min" points will cease to apply.
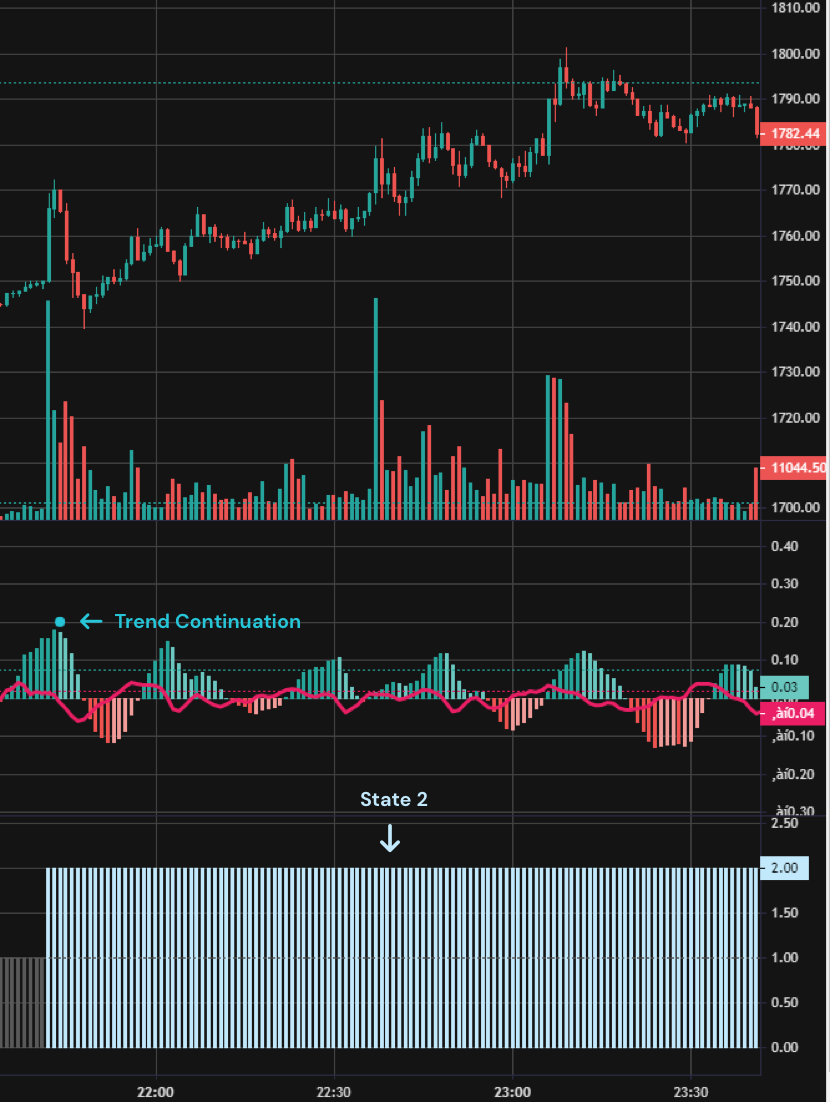
* When the VSM model is in State 2, observe the AI Directional Strength Predictor histogram for high peak values. This suggests that the market may experience a continuation of the current trend, indicating a strong price movement.