
Volatility Switch Model (VSM)
Introduction
Volatility Switch Model (VSM) is a powerful application of machine learning models including Hidden Markov Models (HMMs) that focus on price, volume, and real-time trade data to analyze and predict market state and regime. By harnessing the capabilities of unsupervised machine learning, the VSM provides a simple-to-use framework for understanding and forecasting market volatility.
At its core, the VSM utilizes HMMs to capture the latent states and transitions underlying market dynamics. One key advantage of the VSM lies in its ability to adapt to evolving market conditions. Traditional volatility models often assume volatility as a constant or averaged-value, which fails to capture the inherent fluctuations in market dynamics. In contrast, the VSM dynamically adjusts its hidden states and associated volatility levels based on the observed ML training data, allowing for an agile model that is continuously updated.
The practical usage of Volatility Switch Model (VSM) involves understanding and utilizing its two primary states: State 2(Light Blue), representing high volatility, and State 1(Gray), representing low volatility. In State 1, the Transition Phase(Blue) can be understood as the alert zone between State 1 and State 2. To utilize the VSM effectively, traders and investors should monitor the transitions between these two states. When the model predicts a transition from State 1 to State 2, it suggests an imminent increase in market volatility. This can serve as a signal for traders to adopt more cautious strategies, such as adjusting stop-loss orders or reducing leverage.
Volatility Switch Model (VSM) Usage Guide
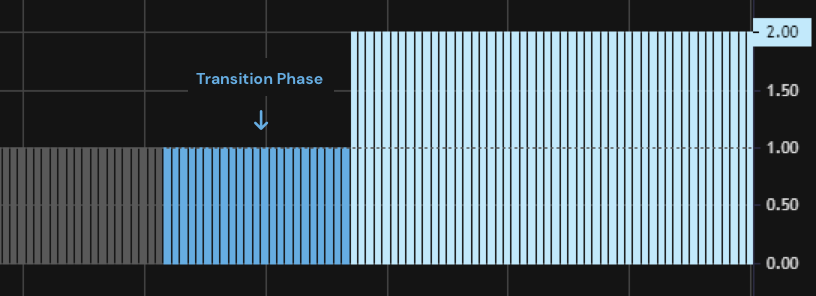
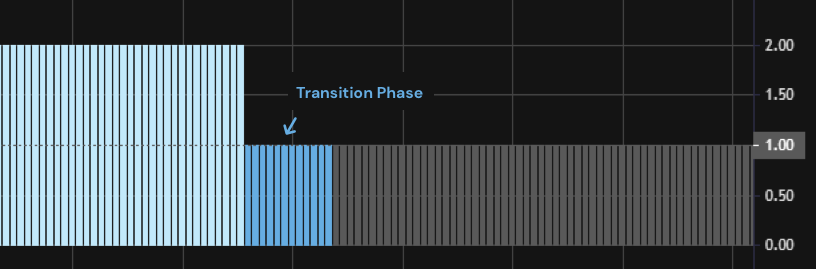
State 1(Gray) represents an oscillating or range bound market, while State 2(Light Blue) signifies high volatility. In State 1, the Transition Phase(Blue) indicates an increased likelihood of transitioning to State 2, suggesting higher volatility. Conversely, From State 2 to State 1, Transition Phase suggests a unsteady state of returning to low volatility. Monitoring these color indicators helps traders anticipate market dynamics and adjust strategies accordingly for optimal risk management. The VSM model provides valuable insights into market behavior and state transitions, aiding informed trading decisions.
Last updated